Page 460 - Computer Software Application TP - Volume 1
P. 460
COMPUTER SOFTWARE APPLICATION - CITS


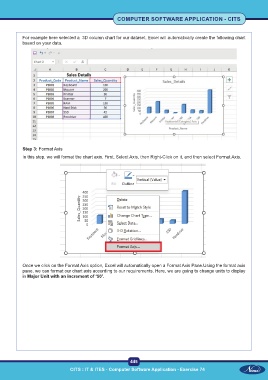
           For example here selected a  3D column chart for our dataset. Excel will automatically create the following chart
           based on your data.


           Step 3: Format Axis
           In this step, we will format the chart axis. First, Select Axis, then Right-Click on it, and then select Format Axis.


           Once we click on the Format Axis option, Excel will automatically open a Format Axis Pane.Using the format axis
           pane, we can format our chart axis according to our requirements. Here, we are going to change units to display
           in Major Unit with an increment of ‘50’.


                                                           445
                                CITS : IT & ITES - Computer Software Application - Exercise 74

