Page 487 - Computer Software Application TP - Volume 1
P. 487
COMPUTER SOFTWARE APPLICATION - CITS


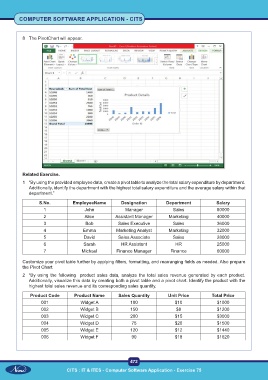
           8  The PivotChart will appear.


           Related Exercise.

           1  “By using the provided employee data, create a pivot table to analyze the total salary expenditure by department.
              Additionally, identify the department with the highest total salary expenditure and the average salary within that
              department.”
                  S.No.          EmployeeName          Designation         Department            Salary
                    1                  John              Manager              Sales              50000
                    2                  Alice        Assistant Manager       Marketing            40000
                    3                  Bob           Sales Executive          Sales              36000
                    4                 Emma           Marketing Analyst      Marketing            32000
                    5                 David           Sales Associate         Sales              28000
                    6                 Sarah            HR Assistant            HR                25000
                    7                Michael         Finance Manager         Finance             60000

           Customize your pivot table further by applying filters, formatting, and rearranging fields as needed. Also prepare
           the Pivot Chart.
           2  “By using  the following   product sales  data, analyze  the total sales  revenue  generated  by each  product.
              Additionally, visualize this data by creating both a pivot table and a pivot chart. Identify the product with the
              highest total sales revenue and its corresponding sales quantity.

              Product Code        Product Name        Sales Quantity        Unit Price         Total Price
                   001               Widget A              100                 $10               $1000
                   002               Widget B              150                 $8                $1200
                   003               Widget C              200                 $15               $3000
                   004               Widget D              75                  $20               $1500
                   005               Widget E              120                 $12               $1440
                   006               Widget F              90                  $18               $1620


                                                           472

                               CITS : IT & ITES - Computer Software Application - Exercise 75

