Page 468 - Computer Software Application TP - Volume 1
P. 468
COMPUTER SOFTWARE APPLICATION - CITS


           Note: To insert the upcoming charts, follow the steps

           Step 1: Open a MS Excel worksheet and click on the “Insert” button from the menu bar.
           Step 2: From the Insert tab, go to the “Charts” option, there you would find different types of charts. You can
           choose the desired chart from it.
           Note: Choose the chart as required. For example: Radar Chart, Filled Radar etc.

           Step 3: Then we need to select the data for which the graph has to be plotted
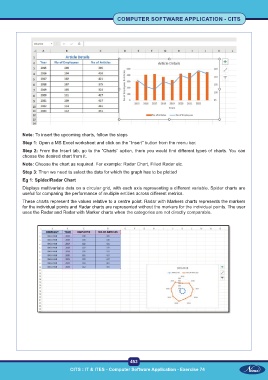
           Eg 1: Spider/Radar Chart
           Displays multivariate data on a circular grid, with each axis representing a different variable. Spider charts are
           useful for comparing the performance of multiple entities across different metrics.
           These charts represent the values relative to a centre point. Radar with Markers charts represents the markers
           for the individual points and Radar charts are represented without the markers for the individual points. The user
           uses the Radar and Radar with Marker charts when the categories are not directly comparable.


                                                           453
                                CITS : IT & ITES - Computer Software Application - Exercise 74

