Page 469 - Computer Software Application TP - Volume 1
P. 469
COMPUTER SOFTWARE APPLICATION - CITS


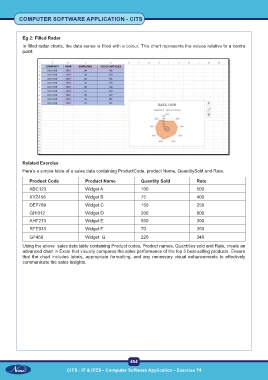
           Eg 2: Filled Radar
           In filled radar charts, the data series is filled with a colour. This chart represents the values relative to a centre
           point.


           Related Exercise
           Here’s a simple table of a sales data containing ProductCode, product Name, QuantitySold and Rate:

              Product Code             Product Name             Quantity Sold           Rate

              ABC123                   Widget A                 100                     500
              XYZ456                   Widget B                 75                      400
              DEF789                   Widget C                 150                     250
              GHI012                   Widget D                 200                     800
              AHF213                   Widget E                 560                     300
              RFE033                   Widget F                 70                      350

              GF456                    Widget  G                220                     340
           Using the above  sales data table containing Product codes, Product names, Quantities sold and Rate, create an
           advanced chart in Excel that visually compares the sales performance of the top 5 best-selling products. Ensure
           that  the  chart  includes  labels,  appropriate  formatting,  and  any  necessary  visual  enhancements  to  effectively
           communicate the sales insights.


                                                           454

                               CITS : IT & ITES - Computer Software Application - Exercise 74

