Page 512 - Computer Software Application TP - Volume 1
P. 512
COMPUTER SOFTWARE APPLICATION - CITS


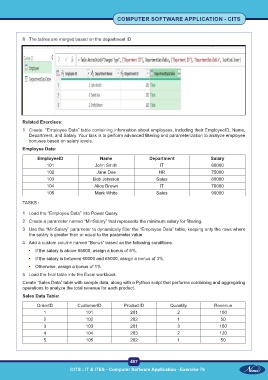
           8  The tables are merged based on the department ID


           Related Exercises:
           1  Create  “Employee Data” table containing information about employees, including their EmployeeID, Name,
              Department, and Salary. Your task is to perform advanced filtering and parameterization to analyze employee
              bonuses based on salary levels.
           Employee Data:

                  EmployeeID                 Name                  Department                  Salary
                      101                  John Smith                   IT                     60000
                      102                   Jane Doe                    HR                     75000
                      103                 Bob Johnson                 Sales                    80000
                      104                  Alice Brown                  IT                     70000
                      105                  Mark White                 Sales                    90000

           TASKS :

           1  Load the “Employee Data” into Power Query.
           2  Create a parameter named “MinSalary” that represents the minimum salary for filtering.

           3  Use the “MinSalary” parameter to dynamically filter the “Employee Data” table, keeping only the rows where
              the salary is greater than or equal to the parameter value.
           4  Add a custom column named “Bonus” based on the following conditions:
              •  If the salary is above 65000, assign a bonus of 5%.

              •  If the salary is between 60000 and 65000, assign a bonus of 3%.
              •  Otherwise, assign a bonus of 1%.
           5  Load the final table into the Excel workbook.
           Create “Sales Data” table with sample data, along with a Python script that performs combining and aggregating
           operations to analyze the total revenue for each product.
           Sales Data Table:

                 OrderID           CustomerID           ProductID            Quantity           Revenue
                    1                  101                 201                  2                  100
                    2                  102                 202                  1                  50
                    3                  103                 201                  3                  150
                    4                  104                 203                  2                  120
                    5                  105                 202                  1                  50


                                                           497
                                CITS : IT & ITES - Computer Software Application - Exercise 76

