Page 516 - Computer Software Application TP - Volume 1
P. 516
COMPUTER SOFTWARE APPLICATION - CITS


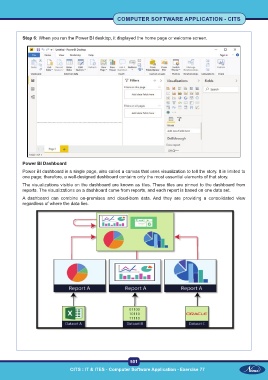
           Step 6: When you run the Power BI desktop, it displayed the home page or welcome screen.


           Power BI Dashboard

           Power BI dashboard is a single page, also called a canvas that uses visualization to tell the story. It is limited to
           one page; therefore, a well-designed dashboard contains only the most essential elements of that story.
           The visualizations visible on the dashboard are known as tiles. These tiles are pinned to the dashboard from
           reports. The visualizations on a dashboard come from reports, and each report is based on one data set.
           A dashboard  can combine on-premises  and cloud-born data.  And they are providing  a consolidated  view
           regardless of where the data lies.


                                                           501
                                CITS : IT & ITES - Computer Software Application - Exercise 77

