Page 520 - Computer Software Application TP - Volume 1
P. 520
COMPUTER SOFTWARE APPLICATION - CITS


           Power BI Reports
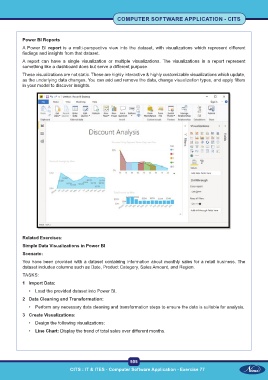
           A Power BI  report  is  a  multi-perspective  view  into  the  dataset,  with  visualizations  which  represent  different
           findings and insights from that dataset.
           A report  can have a single visualization  or multiple visualizations.  The visualizations  in a report represent
           something like a dashboard does but serve a different purpose.
           These visualizations are not static. These are highly interactive & highly customizable visualizations which update,
           as the underlying data changes. You can add and remove the data, change visualization types, and apply filters
           in your model to discover insights.


           Related Exercises:
           Simple Data Visualizations in Power BI
           Scenario:

           You have been provided with a dataset containing information about monthly sales for a retail business. The
           dataset includes columns such as Date, Product Category, Sales Amount, and Region.
           TASKS:

           1  Import Data:
              •  Load the provided dataset into Power BI.
           2  Data Cleaning and Transformation:
              •  Perform any necessary data cleaning and transformation steps to ensure the data is suitable for analysis.
           3  Create Visualizations:
              •  Design the following visualizations:

              •  Line Chart: Display the trend of total sales over different months.


                                                           505
                                CITS : IT & ITES - Computer Software Application - Exercise 77

