
Page 270 - CITS - Computer Software Application -TT
P. 270
COMPUTER SOFTWARE APPLICATION - CITS
Now before we jump into analyzing data using this Pivot Table, let’s understand what are the nuts and bolts that
make an Excel Pivot Table.
Analyzing Data Using the Pivot Table:
Now, let’s try and answer the questions by using the Pivot
To analyze data using a Pivot Table, you need to decide how you want the data summary to look in the final result.
For example, you may want all the regions in the left and the total sales right next to it. You have this clarity in
mind, you can simply drag and drop the relevant fields in the Pivot Table.
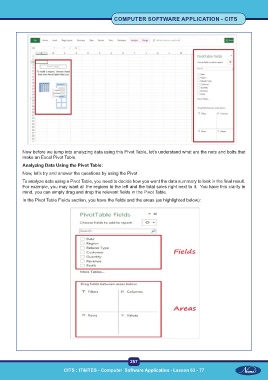
In the Pivot Table Fields section, you have the fields and the areas (as highlighted below):
257
CITS : IT&ITES - Computer Software Application - Lesson 63 - 77